Vanderhoof Community Health Profile
Introduction
Health starts here – where we live, learn, work and play.
When we think of “health” we often think of health conditions like diabetes or cancer, visits to the doctor’s office, or wait times for medical services. But evidence shows that, long before illness, health starts in our homes, schools and jobs. Our health is affected by access to clean water and healthy food, affordable recreational activities, education and employment opportunities.
The provincial government and health authorities are primarily responsible for health by providing health services and promoting healthy living. Local and First Nations governments and community organizations can also play a role in creating the conditions for citizens to make healthier choices and work with partners to promote community well-being. Together we can build healthy and vibrant communities that empower citizens to achieve their best physical and mental health.
The purpose of this BC Community Health Profile is to provide data that facilitates dialogue about community health and planning for improving community health.
Data is provided for your municipality whenever possible, while some data may be for your local health area (LHA) or health service delivery area (HSDA). More information on health boundaries can be found here.
Please note: a dash (-) or N/A within a profile indicates that data for that indicator is not available at this time.Vanderhoof

Nechako Local Health Area
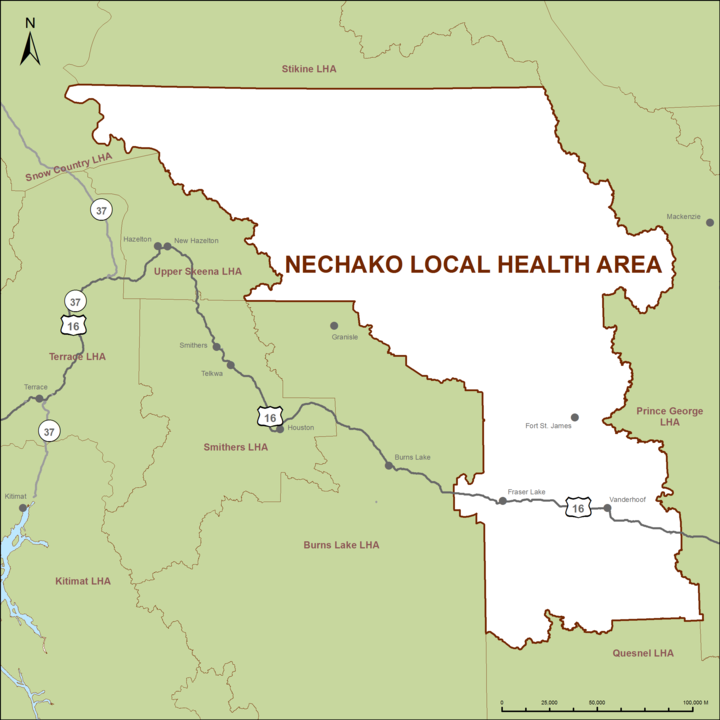
Data is provided for your municipality whenever possible, while some data may be for your local health area (LHA) or health service delivery area (HSDA). More information on health boundaries can be found here.
Please note: a dash (-) or N/A within a profile indicates that data for that indicator is not available at this time.Demographics
Age
The age distribution of your community impacts the supports and services needed in your community. For example, older adults and young families benefit from age-friendly public spaces, like well-maintained sidewalks and rest areas.
Knowing how your population is expected to change in the upcoming years can help you plan ahead to meet the changing needs of your community.
Diversity

A diverse community is a vibrant community. Different population groups often have different opportunities and challenges in maintaining or improving their health. For example, Aboriginal people and new immigrants often face barriers to accessing health services and sustaining health and wellness.
Understanding the unique needs of various cultural groups and people who speak other languages is important for improving overall health in your community.
Factors that affect health
The following section describes some of the factors that influence the health and well-being of our communities. It is important to note that, although these factors impact health in their own right, they are interrelated and work together to contribute towards the health of our communities.
Income
Income greatly impacts health by affecting our living conditions (e.g., adequate housing and transportation options), access to healthy choices (e.g., healthy food options and recreational activities), and stress levels.
Those with the lowest levels of income experience the poorest health and with each step up in income, health improves. This means all segments of the population experience the effect of income on health, not just those living in poverty.
Considering a range of incomes when designing community programs and services can improve access for all.
Average household income
Census of population, Statistics Canada, 2016
$87,186
Vanderhoof
$90,354
BC average
Education

People with higher levels of education tend to be healthier than those with less formal education. Education impacts our job opportunities, working conditions, and income level. In addition, education equips us to better understand our health options and make informed choices about our health.
Offering or partnering with other organizations to deliver informal education, such as skill-building workshops (e.g., literacy training), can contribute towards improved individual and community health.
Employment

Employment provides income and a sense of security for individuals. Underemployment or unemployment can lead to poorer physical and mental well-being due to reduced income, lack of employment benefits and elevated stress levels. Employment conditions such as workplace safety and hours of work can also impact our health.
Offering fair compensation and safe working conditions, and asking your contractors to do so as well, can improve health in your community.
Unemployment rate
Census of population, Statistics Canada, 2016
8.1%
Vanderhoof
6.7%
BC average
Physical environments
Physical environments can promote healthy behaviours by increasing access to healthy food outlets, affordable housing, walking or biking paths, and smoke-free environments.
How we plan and build our communities can make healthy options, like active transportation, more available, affordable, and accessible for everyone.
By keeping health and physical activity accessibility in mind when planning policy and designing physical spaces, communities can help create healthier environments for citizens.
Spending 30% or more of your household income on housing is considered “unaffordable”. Households spending 30% of their income on housing are less able to afford healthy food and other basic living costs.
Health services
Access to health services is essential for maintaining and improving our health. Health authorities and the Ministry of Health are responsible for providing quality services that meet the health needs of communities by preventing, diagnosing, and treating illnesses.
Local and First Nations governments, community organizations, and health authorities can work in partnership to help ensure that their communities’ health needs are addressed.
Available health practitioners per 100,000 residents in Nechako LHA
Report, BC Ministry of Health, 2009-2010
Physicians
127
BC Average: 112
Specialists
−
BC Average: 94
Supplementary practitioners
33
BC Average: 133
Health practitioners are one part of a larger health system that includes many people, facilities, and services that aim to improve health in your community through health care services and health promotion.
Social support

Social support from family, friends, and communities is associated with better health. Having someone to turn to during times of financial or emotional hardship can help to alleviate stress, and caring relationships can protect against health problems. Beyond our immediate social support network, our health is also affected by our sense of community support and connectedness. Community connectedness reflects our commitment to shared resources and systems - for example, our community centres and programs, transportation system, and social safety net.
Through support and provision of social programming, local and First Nations governments, community organizations, and health authorities can increase social support and connectedness in their communities.
In 2015-2016, 73.5% of Northern Interior HSDA population (aged 12 and up) reported a somewhat strong or very strong sense of belonging to their local community. Canadian Community Health Survey, 2015-2016
Early childhood development

Early childhood development has a profound impact on emotional and physical health in later years. Early experiences help children to develop skills in emotional control, relationship building, self-esteem, and health practices that last throughout their lives.
Offering accessible and affordable programs and services for a diverse spectrum of children and families can help support healthy childhood development in your community.
The Early Development Instrument (EDI) is one indicator of healthy childhood development, which measures children in kindergarten in five core areas that are known to be good predictors of adult health, education, and social outcomes: social competence; physical health and well-being; language and cognitive development; emotional maturity; communication skills and general knowledge. The EDI highlights the percentage of children in kindergarten who may be considered vulnerable in one or more of these core areas.
Personal health practices
Personal health practices such as what we eat, how much we drink, how physically active we are, and whether or not we smoke are factors that impact our health. For example, alcohol consumption has been linked to diseases like cancer and kidney disease, and smoking is still a leading cause of death in BC. Health practices are highly influenced by our knowledge of and ability to afford or adopt healthier options.
Supportive social and physical environments can improve everyone’s personal health practices. Communities offer programs and services that increase awareness, build skills, and positively influence personal health practices. Local governments have also had success in improving community health by implementing bylaw and zoning restrictions, such as for tobacco.
Consumption of standard alcoholic drinks per capita in Nechako LHA
Report, Centre for Addictions Research of BC, 2016
1.6/day
Nechako LHA
1.5/day
BC average
Higher than BC Lower than BC
The Potential Years of Life Lost (PYLL) Index estimates the number of years of life ‘lost’ to early deaths (i.e., deaths before age 75). The PYLL Index shows early deaths in your LHA that can be attributed to various behaviours, compared to the BC average. For example, a PYLL Index of 1.20 indicates that your LHA average is 20% higher than the BC average.
Health practices that start early in life are likely to continue into adulthood. This graph shows health practices for students in your LHA.
Health status and chronic disease
Life expectancy

Life expectancy at birth is the average number of years a newborn can be expected to live, and is a reliable indicator of overall health for populations. Life expectancy can approximate length of life, but does not account for quality of life, which is influenced by health and well-being.
Maternal and infant health
Pregnancy and childbirth have a huge impact on the physical, mental, emotional and socioeconomic health of women and their families. Pregnancy-related health outcomes are influenced by a woman’s health and other factors like income, age, race and ethnicity.
Infant mortality rate (<1 year old)
Socioeconomic Profiles, BC Stats, 2011-2015
8 per 1,000 live births
Nechako LHA
4 per 1,000 live births
BC average
Low birth weight rate
Annual report, BC Vital Statistics, 2011-2015
57 per 1,000 live births
Nechako LHA
58 per 1,000 live births
BC average
Injury
Injury is a major cause of death, disability and hospitalization in BC, especially among children, young adults and seniors. Many injuries occur in motor vehicles, on work sites, and during play. Among seniors, falls and fall-related injuries are responsible for significant impairment, loss of independence, and reduced quality of life, and are frequently a marker for underlying, and often untreated, health problems.
Number of people newly hospitalized for injury in Nechako LHA: Discharge Abstract Database, BC Ministry of Health, 2006-20113,012
This indicator contributes to an understanding of the adequacy and effectiveness of injury prevention efforts, including public education, intervention development and use, community road design, prevention approaches and treatment.
Higher than BCLower than BC
Mental health

Positive mental health and well-being is a resource for everyday living, just like our physical health. Having good mental health allows us to stay balanced, enjoy life, cope with stress, and bounce back from major setbacks.
In 2015-2016, 67.3% of Northern Interior HSDA population (aged 12 and up) reported very good or excellent mental health. Canadian Community Health Survey, 2015-2016
Chronic disease
One of the biggest challenges to achieving healthy communities is preventing and managing chronic conditions that develop over time, such as respiratory illnesses, high blood pressure, and heart disease. Chronic conditions result from a complex combination of our genetics, healthy lifestyle practices, and environments. Understanding community health concerns can help local governments and community organizations, in partnership with health authorities, set priorities for better community health.
Cancer
Cancer is one of the leading causes of death in Canada. Over half of all cancers may be prevented through personal health practices such as healthy eating, physical activity, non-smoking, and reduced sun exposure.
Number of people newly diagnosed with cancer in Nechako LHA: BC Cancer Registry, BC Cancer Agency, 2008-2012376
Type 2 diabetes is the most common type of diabetes (90% of all cases) and usually occurs in adults although rates among children are rising. Some people are at higher risk of developing type 2 diabetes, including those who are overweight and those who are Aboriginal, Hispanic, Asian, South Asian or African.
Cardiovascular disease is the leading cause of death among Canadian adults, and includes heart attacks, strokes, heart failure, and heart disease. High blood pressure, also called hypertension, contributes to increased risk of cardiovascular diseases as well as chronic kidney disease. High blood pressure can be caused by an unhealthy diet, harmful amounts of alcohol, physical inactivity, or stress.
Mental illness refers to diagnosable conditions such as depression, anxiety and bipolar disorder. People with mental illness can thrive with access to appropriate services and support.
Asthma often occurs in those with a genetic predisposition to the illness and can be caused by allergens in the environment, tobacco smoke, chemical exposure in the workplace, or air pollution. Chronic obstructive pulmonary disease (COPD) is a long-term lung disease (including chronic bronchitis and emphysema) that is often caused by smoking.
| In one year, number of people in Nechako LHA newly diagnosed with: | |
|---|---|
| Depression or Anxiety* | 165 |
| Asthma | 77 |
| COPD | 71 |
| High blood pressure | 123 |
| Heart failure | 55 |
| Diabetes (type 1 or 2) | 82 |
| Chronic Disease Registries, BC Ministry of Health, 2015 | |
* The information available on mental illness shows the number of people who have been diagnosed for the first time with depression or anxiety, which only captures one aspect of mental health in your community. Because these figures are based on diagnosis, they do not capture those individuals who have not sought medical help.
The number of people newly diagnosed with a disease each year is called the incidence. Incidence is often presented as a rate, such as the number of people who get sick per 1,000 people in the community. The above graph displays how the incidence rates of various chronic conditions have changed over time in your health authority.
As a population ages, the incidence rate of chronic diseases is expected to rise. Age-standardized rates (as shown in this graph) allow you to compare chronic disease rates over time, regardless of an aging population.
Comparison to BC
The summary below highlights how your community is doing compared to the provincial average.
The graph displays the BC average as a black line and your community’s data as a coloured bar on either side. The length of the bars represent percent difference between community data and provincial average.
| Income (dollars, 2016) | Community | BC | ||
| Average household income | $87,186 | $90,354 | ||
| Affordable housing (per cent, 2016) | Community | BC | ||
| Owners spending >30% income on shelter | 6.0 | 20.7 | ||
| Renters spending >30% income on shelter | 28.6 | 43.3 | ||
| Education (per cent, 2016) | Community | BC | ||
| High school diploma or higher education | 76.6 | 84.5 | ||
| Employment (per cent, 2016) | Community | BC | ||
| Unemployment rate | 8.1 | 6.7 | ||
| Active Transportation (per cent, 2016) | Community | BC | ||
| Population walk to work | 8.1 | 6.8 | ||
| Population bike to work | 1.4 | 2.5 | ||
| Life expectancy at birth (years, 2011-2015) | LHA | BC | ||
| Total | 78.2 | 82.6 | ||
| Female | 80.2 | 84.6 | ||
| Male | 76.7 | 80.6 | ||
| Chronic disease (age-standardized prevalence rate) (per cent, 2015) | LHA | BC | ||
| Asthma | 11.9 | 12.1 | ||
| COPD | 7.7 | 6.2 | ||
| Diabetes | 7.3 | 8.0 | ||
| Heart failure | 2.9 | 2.0 | ||
| High blood pressure | 24.2 | 22.8 | ||
| Chronic disease (age-standardized incidence rate) (per 1,000, 2015) | LHA | BC | ||
| Asthma | 4.9 | 6.1 | ||
| COPD | 11.3 | 7.6 | ||
| Diabetes | 5.6 | 6.1 | ||
| Heart failure | 4.3 | 3.2 | ||
| High blood pressure | 16.8 | 19.8 | ||
| Maternal and infant health (per 1,000 live births, 2011-2015) | LHA | BC | ||
| Infant mortality rate | 8 | 4 | ||
| Low birth weight rate | 57 | 58 | ||
| Students eating 5 or more servings of fruits and vegetables per day (per cent, 2015-2016) | LHA | BC | ||
| Grade 3/4 | 47 | 51 | ||
| Grade 7 | 41 | 46 | ||
| Grade 10 | 37 | 43 | ||
| Grade 12 | 38 | 42 | ||
| Students who are physically active (per cent, 2016-2017) | LHA | BC | ||
| Grade 3/4 | 31 | 38 | ||
| Grade 7 | 52 | 55 | ||
| Grade 10 | 53 | 54 | ||
| Grade 12 | 56 | 48 | ||
| Students who do not use tobacco or nicotine (per cent, 2016-2017) | LHA | BC | ||
| Grade 7 | 94 | 95 | ||
| Grade 10 | 75 | 78 | ||
| Grade 12 | 50 | 72 | ||
| Vulnerability in early childhood (per cent, 2013-2016) | LHA | BC | ||
| One or more areas of vulnerability | 34 | 32 | ||
Glossary
Aboriginal: 'Aboriginal' includes persons who reported being an Aboriginal person - that is, First Nations (North American Indian), Métis or Inuk (Inuit), and/or those who reported Registered or Treaty Indian status registered under the Indian Act of Canada, and/or those who reported membership in a First Nation or Indian band.
Age-standardization: Age-standardized rate is a rate that would have existed if the population had the same age distribution as the selected reference population. The BC Community Health Profiles use estimates for a given year (1991 or 2011) as the reference population, and chronic disease incidence and prevalence rates have been age-standardized using the direct standardization method with five-year age groups.
Chronic disease: Chronic diseases, also known as non-communicable diseases, are diseases that are persistent and generally slow in progression, which can be treated but not cured. Chronic diseases often have common risk factors, such as tobacco use, unhealthy diet, and physical inactivity. Societal, economic, and physical conditions influence and shape these behaviours and affect chronic disease rates in communities. Note: the information presented in the profiles on chronic diseases shows the number of people who have been newly diagnosed. Because these figures are based on diagnosis they do not capture those individuals how have not sought medical help.
Drug-induced deaths: Deaths due to drug-induced causes. This category of deaths excludes unintentional injuries, homicides, and other causes that could be indirectly related to drug use. Deaths directly due to alcohol are also excluded.
Incidence: The number of people newly diagnosed with a disease in a population during a specific time period is called the incidence. Incidence is often presented as a rate, such as the number of people who get sick per 1,000 people.
Infant mortality rate: Infant mortality rate is the number of deaths among children less than one year of age per 1,000 live births.
Injury hospitalization: Acute care hospitalization due to the first occurrence of injury resulting from the transfer of external energy to the body (excluding poisoning and other non-traumatic injuries). Poisoning, adverse effects of drugs/medicine, choking, late effects and several other conditions are excluded. Newborns are also excluded.
New immigrant: 'Immigrant' refers to a person who is or has ever been a landed immigrant or permanent resident in Canada. In the BC Community Health Profiles 'new immigrants' are individuals who, at the time of the Canadian Census 2016 (May 10th), had immigrated to Canada within the past five years.
Physically active: The profile reports the percentage of students who report achieving more than 150 minutes of moderate to vigorous physical activity per week in the BC Ministry of Education Student Learning Survey. Although this value indicates there is some regularity in participating in physical activity each week, it does not represent the percentage of youth meeting the Canadian Physical Activity Guidelines (i.e. achieving health benefits through being physically active at least 420 minutes per week).
Prevalence: The total number of people with a disease in a population during a specific time period is called the prevalence. Prevalence differs from incidence in that it includes people who have been living with the disease for many years. (Incidence only includes people newly diagnosed with a disease in a given time period.) Prevalence is often presented as a rate - the number of people living with a disease per 100 people.
Smoking-attributable deaths: Since death certifications lack complete and reliable data on smoking, estimation techniques are used to approximate the extent of smoking-attributable deaths. Smoking-attributable deaths are derived by multiplying a smoking-attributable mortality percentage by the number of total deaths aged 35+ in specified cause of death categories. These categories are comprised of selected malignant neoplasms, circulatory system diseases, and respiratory system diseases.
Standard alcoholic drink: A standard drink is a unit that is used to measure alcohol intake. In Canada, a standard drink is any drink that contains 13.6 grams of pure alcohol or the equivalent of 0.6 ounces of 100% alcohol. (E.g., one 12-ounce can of beer, containing 5% alcohol; one 5-ounce glass of wine, containing 12% alcohol; one and a half-ounce liquor or spirits, containing 40% alcohol.)
Supplementary practitioners: Practitioners who provide services insured through the MSP Supplementary Benefits program or the Midwifery program and who are approved for licensure by their respective Colleges/Associations.
Visible minority: Visible minority refers to whether a person belongs to a visible minority group as defined by the Employment Equity Act. The Employment Equity Act defines visible minorities as 'persons, other than Aboriginal peoples, who are non-Caucasian in race or non-white in colour.'
References
- Statistics Canada. (2018) 2016 Census of population.
- BC Stats. (2015) Sub-Provincial Population Projections - P.E.O.P.L.E.
- Statistics Canada. (2018) Canadian Community Health Survey.
- BC Ministry of Health. (2011) BC health - population, practitioners, services and expenditures by Local Health Area, from MSP.
- Human Early Learning Partnership. (2018) Early Development Instrument.
- Centre for Addictions Research of BC. (2018). BC Alcohol and Other Drug (AOD) Monitoring Project: Alcohol Consumption.
- BC Vital Statistics. (2015) Annual Report.
- BC Ministry of Education & BC Stats. (2018) Student Learning Survey for Grades 4, 7, 10 and 12
- BC Stats. (2018) Life expectancy.
- BC Ministry of Health. (2015) Population Denominators V2013 and Discharge Abstract Database.
- BC Ministry of Health. (2018) Chronic Disease Registries.
- BC Cancer Agency. (2015) BC Cancer Registry.
Acknowledgements
BC Community Health Profiles were developed by the Provincial Health Services Authority in support of Healthy Communities across BC in partnership with the Ministry of Health, health authorities, BC Observatory for Population and Public Health, the Union of BC Municipalities, and PlanH. These profiles will help inform local government and community organizations on the health and well-being of their communities. The Ministry’s primary prevention strategy recognizes the importance of local interests in supporting the creation of environments that promote healthy living.